Abstract
This study predicts daily returns of the Nigerian Stock Exchange (NSE) using Nigerian daily news headline. The Vanguard newspaper is used as the source of information, to collate 11 years (2February 2, 2012 to September 29, 2023) of daily news headlines and data on the daily returns All-Shares Index (ASI) of the Nigerian Stock Exchange NSE was collared from the website https://ng.investing.com/indices/nse-all-share-historical-data. Text mining techniques such as Term Frequency-Inverse Document Frequency (TF-IDF) are applied to pre-determine important words and sentences and their influences on daily market returns. N-gram sentences are used to build bigrams and trigrams, which helps us determine their positive and negative returns. The result shows that when words such arabia, crypto, renewal, paris, and tradermoni appear in news headlines, there is negative returns in the stock market, but when words such as lawmakers, multinationals, ebonyi, constraints and double appear in the news headline, there is positive return. For bi-gram sentences when sentences such as price dip, earning rise, tax compliance, and econbank partners appear, there is often negative return, on the other hand when sentences such as trustfunds pensions, inter agency, business insurance, index rise and forex supply appear in the news headline, there is often positive return. And for tri-gram sentences, when sentences such as profit taking NSE, government private sector, cross boarder trade, cargo tracking note, and capital market sec, there is often negative return in NSE, on the other hand, when sentence such as poor purchasing power, naira watch cbn, mtn google empower, google empower smes and external reserve hit appear in the news headlines, there is often a positive returns in the stock market. Three machine-learning models were used to build the predictive models. The models were logistic regression with a prediction accuracy of 0.52, Support Vector Machine (SVM) with an accuracy of 0.51, and K-nearest Neighbour (KNN) with an accuracy of 0.99, indicating higher prediction evidence of news headlines by the KNN model for the NSE index over the alternative models. We limited fitting the models using only unigrams and left fitting models using bigrams and trigram sentences for future research.
Keywords
Nigerian Stock Market, News Headlines, Machine Learning Models, Term Frequency-Inverse Document Frequency
1. Introduction
The stock market is a channel for long-term investment funds. For a profit-oriented rational agent, the essence of investing in stocks is positive returns, whereas returns on investment in stocks change as stock price change over time. The ability to predict stock price changes is a major concern because investors are interested in future stock pricing trends to make portfolio decisions. Thus, accurate prediction of stock returns is important for optimal portfolio decisions to guarantee positive returns on investment. In other words, a good prediction can mitigate unexpected risk and loss of financial assets.
Extensive studies on stock return prediction using conventional statistical methods exist in advanced and less-developed countries, some of which include
| [6] | Ibrahim, O. Sikiru (2017). Forecasting the Volatilities of the Nigeria Stock Market Prices. CBN Journal of Applied Statistics 8(2); 23-45. |
| [7] | Isenah, M. G. and Olubusoye O. E. (2014). Forecasting Nigerian Stock Market Returns using ARIMA and Artificial Neural Network Models. CBN Journal of Applied Statistics 5(2); 25-48. |
[6, 7]
for Nigeria. In recent times, time series econometrics has been shown to have some limitations in predicting stock returns. In line with the efficient market hypothesis, Chenglin, et al.
argue that it is difficult to predict stock returns with a simple time series model due to complex non-stationary and nonlinear nature of the series, being affected by several factors as in the studies
| [3] | Atoi, N. V. (2014): Testing Volatility in Nigeria Stock Market using GARCH Models. CBN Journal of Applied Statistics Vol. 5 No. 2. |
| [18] | Srivastava, A. N., & Sahami, M. (2009). Text mining: Classification, clustering, and applications. Chapman and Hall/CRC. |
| [19] | Uzuke, C. A., & Daniel, J. (2016). Timeseries Analysis of All Shares Index of Nigerian Stock Exchange: A Box-Jenkins Approach. International Journal of Sciences, 5(06), 23-38. https://doi.org/10.18483/ijSci.922 |
| [20] | Yaya, O. S. (2013). Nigerian Stock Index: A Search for Optimal GARCH Model using High Frequency Data. CBN Journal of Applied Statistics, 4(2): 69-85. |
[3, 18-20]
, predicting stock returns requires formulation of equity premium forecasts based on large sets of conditioning information, however, conventional statistical models become unreliable in such circumstances.
New developments in economic analysis lie in the use of unstructured data with large volumes, velocities, and diverse varieties, such as textual information on stock prices from daily newspapers. These features of unstructured data are plausible for machine learning algorithm. Studies have shown the importance of textual information across various fields and have found that stock market information culled from newspapers contains information useful for predicting both earnings and stock returns. For instance, Li, B., et al.
| [11] | Li, B., Chan, K. C., Ou, C., & Ruifeng, S. (2017). Discovering public sentiment in social media for predicting stock movement of publicly listed companies. Information Systems, 69, 81-92. https://doi.org/10.1016/j.is.2016.10.001 |
[11]
empirically revealed that news variables provide useful information for predicting stock market returns in Taiwan. Following Abe and Nakayama
| [1] | Abe, M., & Nakayama, H. (2018). Deep learning for forecasting stock returns in the cross-section. In Advances in Knowledge Discovery and Data Mining: 22nd Pacific-Asia Conference, PAKDD 2018, Melbourne, VIC, Australia, June 3-6, 2018, Proceedings, Part I 22 (pp. 273-284). Springer International Publishing. https://doi.org/10.48550/arXiv.1801.01777 |
[1]
, the powerful deep learning method in machine learning can accurately forecast stock returns one month in advance for a diverse range of stocks in the Japanese market. In terms of predictive accuracy, some comparative studies found more support for analytical outcomes from textual information than time-series econometrics. This study is the first of its kind to apply machine learning techniques to predict stock returns in Nigeria using news headlines, as no previous research has explored this approach.
Text mining is the process of distilling actionable insights from text. Kwartler, T.
| [10] | Kwartler, T. (2017). Text mining in practice with R. John Wiley & Sons. |
[10]
. The user interacts with document collection over time and text filtration is performed by certain machine learning tools. During this process, useful information is extracted from the data sources by identifying and exploring the patterns. Data sources for text mining are document collections, and interesting patterns are unstructured textual data in document collections
| [5] | Feldman, R., & Sanger, J. (2007). The text mining handbook: advanced approaches in analyzing unstructured data. Cambridge university press. |
[5]
. Text-mining techniques are mainly used for extracting a pattern from unstructured data
| [21] | Yaya, O. S., Bada, A. S. and Atoi, N. V. (2016). Volatility in the Nigerian Stock Market: Empirical Application of Beta-t-GARCH Variants. CBN Journal of Applied Statistics, 7(2): 27-48. |
[21]
. With the high level of textual data on a daily basis, with much interest in the stock market, and the capacity to predict with much accuracy whether there will be an increase or decrease in stock market performance in terms of the daily price index, thus we would like to see the impact of Nigerian daily headline textual data on the Nigerian stock market index.
The term Frequency-Inverse Document Frequency (TF-IDF) is a numerical statistic commonly used in information retrieval and text mining and serves as a weighting factor to reflect the importance of a term (word) to a document relative to the whole document collection or corpus. The basic intuition captured by the TF-IDF is that the more often a term occurs in a document, the more it is representative of its content while the more documents a term occurs in, the less discriminating the term becomes. Thus, the computed TF-IDF value increases proportionally with the number of occurrences of a word in the document. Variations in TF-IDF values are often used in search engines, stop-word filtering, and text summarization. The TF-IDF provides descriptive measures, whereas Logistic Regression, Support Vector Machine (SVM), and K Nearest Neighbour as supervised learning models, classification using a regression approach. In addition to linear classification, these models effectively compute nonlinear classification. Both the TF-IDF and these machine-learning models were used in this. TF-IDF is used for the description of the dataset, whereas machine learning models are used for prediction.
With the wide embrace of machine learning algorithms to stock return predictability and given the dearth of its applicability to the Nigerian stock market, this study seeks to examine the usefulness of three machine learning models in predicting stock returns in Nigeria using business news headlines culled from Nigerian daily newspapers. According to Chenglin et al.
, the SVM is a common data-mining algorithm in the field of machine learning. Thus, the TF-IDF and logistic regression, SVM, and KNN techniques of machine learning are applied in this paper to predict stock price movements in the Nigerian Stock Exchange (NSE) based on daily news sentiments from February 2, 2012, to September 29, 2023. The Vanguard newspaper is a well-known Nigerian print and online media firm with a long history of business news headlines.
This study identifies words and sentences that determine NSE positive and negative returns using daily news headlines; and predict daily stock returns by applying ML algorithms on daily news headlines. The outcome of this study is useful for stock market regulators, and particularly for stock market investors in making well-informed portfolio management decisions to minimize risks arising from stock price changes. This study also helps bridge the literature gap in Nigeria.
The rest of this paper is organized as follows: Section 2 presents the literature review, while Section 3 examines the methodology applied in the study. Section 4 presents the data analysis and discussion of the results, while Section 5 concludes with some recommendations.
2. Literature Review
Understanding the movement of stocks is an interesting area of study. Having a model with a higher degree of precision is of utmost importance and, researchers have developed various models with the intent of increasing the accuracy at which one can determine the future outcome of stock movement. Most of the existing econometric models make use of numerical data, but with the arrival of machine learning methods, models have also been developed to use text mining in machine learning to predict stock market returns.
2.1. Theoretical Literature
Newspaper headlines provide two functions that make it easier to filter information. One, the headline summarizes the article, and the second, it serves as a way of attracting the attention of readers
. Kuiken et al.
found that readers preferred headlines that were creative, confusing, or less informative. Readers value headlines based on the visual image they evoke rather than being drawn in by an impression that ultimately makes them less interested or intrigued to read a specific article. The era of reading hard copy newspapers is phasing out little by little, rather online newspapers are subscribed to, and trending news/topic pops up on our phones and laptops which are read. Readers now rely heavily on online news articles, accessing them on their mobile phones and laptops, as long as they have an Internet connection. This trend mirrors the way newspapers were delivered to individual offices or homes.
Olley and Chile
| [15] | Olley, O. W. (2015). Readers' perception of Nigerian newspapers on the internet. In Journal of Philosophy, Culture and Religion (Vol. 4, pp. 26-34). |
[15]
, in studying readers’ perception of Nigerian newspapers on the internet found that the internet is a relevant medium of communication in our modern society, especially in the media environment vis-à-vis the newspaper owing to the various potentials which the internet displays. This development has also given Nigerian readers a medium of replying to publications in the newspaper, as the various newspapers have established a feedback mechanism on the Internet for readers to post their views or reactions. Even with this, many Nigerians still do not fancy reading newspapers online because they believe that the Internet is a place where any faceless individual can post whatever he likes for public consumption. Their study showed a notable improvement in readers’ beliefs, patronage, and need for feedback. Again, there is no maximum utility in the feedback avenues offered by such newspapers for online newspaper readers. Additionally, they observed that there was gross and less awareness of Nigerian online newspapers among many Nigerians. For this reason, the utility for the readership of Nigerian online newspapers and foreign newspapers is far less than expected. From the above findings, it can still be upheld that audience perception and utilization of the Nigerian online Newspaper is fast-growing and taking a positive approach.
Because of easy access to information, the stock market news is also available to users of phones and laptops with access to the internet. Having information readily available has an impact on the competition between investors who are profit oriented according to the Efficient market hypothesis (EMH), which asserts that the reason why many investors are unable to consistently earn above average market is because current market stock prices reflect public information
, which it’s safe to say news headlines play a major role in making this information available to the public.
Generally, there are many factors that affect stock market returns. The stock market may be affected by factors such as financial condition, and traders’ expectation which news headline can also cause. It therefore means that the accurate prediction of stock market return may be difficult. There have been many methods developed for the prediction of stock market returns, and in recent times, data mining methodology has proven to produce excessive forecasting accuracy in the prediction of stock returns
| [16] | Osisanwo, B. G., & Atanda, A. A. (2012). Determinants of stock market returns in Nigeria: a time series analysis. African Journal of Scientific Research, 9(1). |
[16]
.
2.2. Empirical Literature
The internet has plays a vital role in the dissemination of information since it was created, and as time passes, people rely heavily on the internet to transmit information swiftly. This shift to internet news has also shown to have an impact on the stock market returns, moving from the conventional focus on structured data to unstructured data as well. Shahi et al.
| [17] | Shahi TB, Shrestha A, Neupane A, Guo W. Stock price forecasting with deep learning: A comparative study. Mathematics. 2020; 8(9): 1441. https://doi.org/10.3390/math8091441 |
[17]
in their study of stock price prediction with deep learning assessed the impact financial news sentiment will have when factored into the prediction of stock market. Their study showed that Long Short-term memory (LSTM) and gated recurrent unit (GRU) greatly improved in performance in the prediction of the stock market returns when financial news headlines were factored in. Consideration factors such as political and international events in the prediction of stock returns,
| [8] | Kohara K, Ishikawa T, Fukuhara Y, Nakamura Y. Stock price prediction using prior knowledge and neural networks. Intelligent Systems in Accounting, Finance & Management. 1997; 6(1): 11–22. |
[8]
extracted event knowledge from newspaper headlines according to prior knowledge and put them into neural networks. This resulted in a stock returns prediction error lower than that of a multiple linear regression analysis with 5% significance level. Melody et al,
| [12] | Moh, M., Gajjala, A., Gangireddy, S. C. R., & Moh, T. S. (2015, December). On multi-tier sentiment analysis using supervised machine learning. In 2015 IEEE/WIC/ACM International Conference on Web Intelligence and Intelligent Agent Technology (WI-IAT) (Vol. 1, pp. 341-344). IEEE. https://doi.org/10.1109/WI-IAT.2015.154 |
[12]
, in their study of news sentiments as a leading sign for recession, used topic modelling algorithm and sentiment scoring techniques to build a single metric that served as a leading indication in recession prediction models. These researchers observed that sentiments indicators from news data will improve the precision of forecasting recession because of the immediate degree of polarity of the information on purchasers and manufacturer it provides. In trying to see if categorization of text data will help in the prediction of the stock market returns,
| [13] | Mittermayer, M. A. (2004, January). Forecasting intraday stock price trends with text mining techniques. In 37th Annual Hawaii International Conference on System Sciences, 2004. Proceedings of the (pp. 10-pp). IEEE. https://doi.org/10.1109/HICSS.2004.1265201 |
[13]
, used text mining technique to forecast intraday stock price trends. LI Bing et al.
| [11] | Li, B., Chan, K. C., Ou, C., & Ruifeng, S. (2017). Discovering public sentiment in social media for predicting stock movement of publicly listed companies. Information Systems, 69, 81-92. https://doi.org/10.1016/j.is.2016.10.001 |
[11]
, sifting information from public sentiments on social media built social medial analyzer (SMEDAN-SA) model to predict the stock returns of business listed in the public market. Although there is little study in Nigeria on using natural language processing (NLP) in the prediction of stock returns,
| [14] | Nwabueze, C., Okafor, I., & Obiakor, C. Exposure to Economic News on News Tickers and its Influence on Perception of Nigeria Economy by Television Audience in Awka. |
[14]
showed that exposure to economic news either on television or internet is dominated by fear as is shown in the study of economic news tickers and its influence on Nigeria’s economy as revealed in Awka audience.
3. Data and Methodology
3.1. Data
Text data were used for our analysis. The dataset was obtained by scraping the online newspaper website of Vanguard. We collected 11-year time-series data from Vanguard's news headlines from February 2, 2012 to September 29, 2023. The Vanguard newspaper was selected because it is the sole renowned Nigerian newspaper with a rich historical archive of its business news headlines, making it easily accessible to the authors. We have extracted the business news headlines from the Vanguard newspaper website https://www.vanguardngr.com/category/business. Our research specifically aimed at collecting key information regarding the business sector. To estimate the returns in the stock market, we gathered data on the All-Shares Index (ASI) of the Nigerian Stock Exchange NSE from the website https://ng.investing.com/indices/nse-all-share-historical-data. By utilizing daily price fluctuations, we successfully determined upward trends as stocks experienced positive changes, whereas downward trends were identified by negative changes in stock value. Thus, stock price increases are labeled as 1, while stock price decreases are labeled as 0. The NSE serves as a comprehensive log that captures daily fluctuations in stock movements. R Software was used to analyze the data, including web scraping which was used to scrape out news headlines. The R script that was used in collecting the data from the Vanguard newspaper website is attached in the appendix.
After scraping the daily news headlines from the Vanguard web with the dates, and collecting the All-Share returns daily historical data from investment.com, we had to prepare the data for analysis. First, we have to note that news headlines are updated seven days a week against stocks that trade five days a week. Using the merge command in R, we merged the news headline and daily all share returns by date automatically removed weekends and left the 5 working days a week. The dataset has three columns: the first column contains the date; the second column contains the deadlines and third column contains the NSE daily stock.
3.2. Theoretical Frame Work and Model Specification
3.2.1. The TF-IDF
TF-IDF is the product of two statistics: the term frequency (TF) and the Inverse Document Frequency (IDF). The TF uses the raw count of a term in a document, that is, the number of times the term occurs in document. The IDF measures how much information the word provides, that is, whether it is common or rare across all documents. This is the logarithmic-scaled inverse function of documents that contain the word. The mathematical expression of the TF-IDF is as follows:
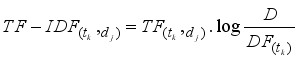 (1)
(1) where

denotes the term frequency – the number of times term tk appears in document dj, while

implies Document Frequency – the number of documents in which terms tk appears and

denotes the total number of documents in the collection.
3.2.2. Logistic Regression
Logistic regression is a powerful statistical technique that is used to predict binary outcomes. Where the dependent variables often had only two outcomes. It is a machine-learning regression model used in determining the relationship between the dependent variable and independent variables.
(2)
where are the indenependent variables; is the probability that the dependent variable is equal to 1.
3.2.3. Support Vector Machines (SVM)
Support vector machines (SVM) with only two classes are used for classification problem. This is an extension of the support vector classifier, which classifies the dataset, depending on the side of the hyperplane it is located. It chooses a hyperplane to correctly separate the given data into two classes and may allow for misclassification. The SVM builds on this by enlarging the feature space using kernels. Kernels help in converting non-separable problems into separable problems by adding more dimensions to the feature space. The primary objective of the SVM is to correctly classify the data into its classes and determine the maximum marginal hyperplane. The linear support vector classifier is given as
where there are parameters , one per training observation. To estimate the parameters and , we need to be the inner products between all pairs of training observations. The notation means , and provides the number of pairs among a set of items.
3.2.4. K Nearest Neighbour
The K nearest neighbor (KNN) is a machine learning algorithm that uses proximity to make classification or prediction of a given dataset. For classification problems, the assignment of data points is performed by counting the majority votes, implying that a class is assigned where it is determined by the majority of votes to be more found. Because, the objective of the KNN is to identify the data points close to a given query, the distance plays a measuring role, as this helps to determine the data points closest to the query. Distance metrics are crucial for measuring distances achieve this goal. A commonly used metric is the Euclidean distance measure, although it is only suitable for real-valued vectors. The formula used is as follows:
Using R to carry out our analysis, the following steps were undertaken: prepare the data for analysis, and exploration. Once the dataset was cleaned, we delved into its depth by investigating the most frequently occurring words during an upturn in the NSE All-Share Index, as well as those that surfaced most frequently during a downturn. Using N-grams, we created uni-grams, bi-grams, and trigrams to determine words, and combinations of words that affect stock returns negatively or positively. The TF-IDF was used in filtering out the most important words in the text, rather than just selecting words that occur more/most frequently. We effectively visualized the results of TF-IDF using bar graphs. To ensure clarity, we plotted words against their corresponding term frequencies (TF) after performing the TF-IDF analysis. After carrying out the descriptive statistics aspect of our analysis, we built three classification models to help in the prediction of daily Nigerian stock returns using news headlines. The models built were the logistic regression, the support vector machines, and the k-nearest neighbor models.
3.2.5. Model Evaluation
For this work, the models used are evaluated using the confusion matrix.
Having imbalanced data set causes a lot of challenge in classification problems, and often, there is a challenge of measuring the accuracy of the model, and hence why we opt for confusion matrix which presents the classification summary in a matrix form. The matrix presentation contains the correct and incorrect classification of the problem we are trying to classify using a particular model. The
Table 1 below is a Confusion Matric.
Table 1. A Confusion Matrix.
Predicted/Actual | Positive Class | Negative Class |
Positive Class | TP | FP |
Negative Class | FN | TN |
From the
Table 1 above, True positive

(also known as recall in some fields) is the number of data points effectively categorized from the positive class. False positive

is the variety of data points expected to be in a positive class however, belonging to the negative class. True negative

is the variety of data points successfully labeled from the negative class. False negative

is the variety of data points predicted to be within the negative class, however belonging to the positive class.
To measure the performance of our models using a confusion matrix, we use the formula below:
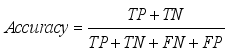 (5)
(5) The result of the accuracy is presented in percentages, which gives us the percentage of accuracy for each model.
3.3. Pre-Processing and Estimation Procedure
In this section, we shall give a detailed procedure on how the Pre-Processing and estimation will be carried out.
3.3.1. Pre-Processing
The following was done in the Pre-Processing.
I. Import all the libraries need for the data preparation and analysis.
II. Import the NSE daily returns and Vanguard daily news headlines data sets into R.
III. Proceed to carry out Exploratory Data Analysis (EDA). With the EDA, we determine that NSE does not trade on weekends. We also observed that data had different headlines with the same dates. All weekend news headlines are removed from the data, and news headlines with the same dates are combines into one column.
IV. We merged the data to have three columns; Date, NSE returns and Daily News Headline.
V. Prepare the data for descriptive Statistics. We tokenized daily news headlines and grouped it by NSE daily return, to help us get the words and counts when the NSE daily returns was positive or negative, and simultaneously, we cleaned the data by removing special characters, numbers, punctuations, stop words.
VI. For the Estimation, we created a corpus, made all letters lower case, removed numbers, removed stop words, removed punctuation, stripped white space, and created a document term matrix to enable us carryout estimation.
3.3.2. Estimation Procedures
The following are the procedures for the estimation process:
I. After the Pre-processing for Descriptive Statistics, we use the created tokens to get the term frequency inverse document frequency and created Uni-gram, Bigram, and Tri-gram and plot bar graphs showing us the words and sentences with high frequencies when we have NSE daily return to be positive or negative.
II. After Pre-processing the data for modelling, we split the document term matrix into training and testing data sets. We used the train data set to build the models and use the test data to test the accuracy of the models.
III. After building our models, we shall then create a confusion matrix for all the models to have the measure of accuracy for each of the models.
4. Results and Discussion
I. The Corpus had a total of 23480 documents and a total of 24755 terms. After carrying out all these operations, we had a total of 2340 documents and a total of 12500 terms remaining.
II. To ensure that the terms left had relevance, we then carried out a term frequency to eliminate terms that appeared less than 10 times in all 2340 documents, and after the operation, we were left with 2142 terms.
After successfully carrying out pre-processing, we had 2340 documents and 2142 terms ready for descriptive statistics and modeling.
4.1. Descriptive Statistics
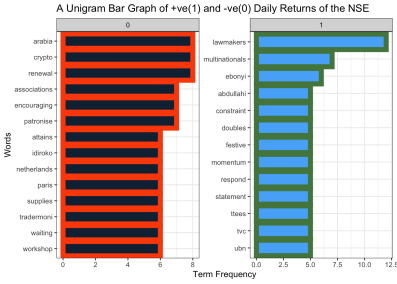
The TF-IDF was used to determine the common words and sentences associated with either positive or negative returns of Nigerian stock returns, as coloured in RED and GREEN, respectively. Figure 1, shows that words such as arabia, crypto, renewal, paris, and tradermoni, are among top 10 words that affect the stock market return negatively. Thus, one can infer from seeing these words in the news headline, that there will be a negative stock return. On the other hand, words such as lawmakers, multinationals, ebonyi, constraints and double, are among top 10 words that affect the stock market return positively. From the above, we can infer that when such words appear in the daily news headlines, the NSE will likely experience a positive return.

Figure 1. A Bar Graph of Unigram for NSE Negative and Positive Returns.
Figure 1 indicate that some single words do not have much meaning, and although they give us clues as to words that may help us infer positive or negative NSE return, the words standing by themselves do not have much meaning. To help increase the chances of consistency, we built a two-word sentence called bigram to help us determine the set of two words that often infer positive and negative NSE returns.
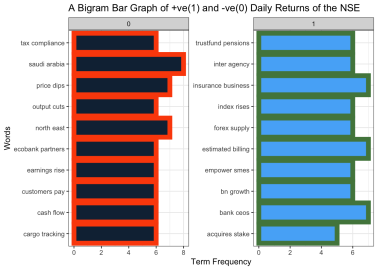
Figure 2 shows the top two words sentence that can help us make this inference. Sentences such as price dip, earning rise, tax compliance, and econbank partners are among top 10 two word sentence that appear when there is an NSE negative return. This implies that, when we see these sentences in the news headline, we should prepare for a possible negative NSE return. On the other hand, we see those sentences such as trustfunds pensions, inter agency, business insurance, index rise and forex supply are among top 10 two word sentences that appear when there is an NSE positive return. This implies that when we see these sentences in the news headline, we should prepare for a possible positive NSE return.
Figure 2. A Bar Graph of Bigram for NSE Negative and Positive Returns.
In
Figure 2, we can make more sense of the words than in
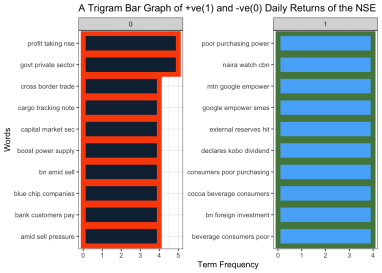
Figure 1. For more clarity, we created a trigram to help build better sentences. From
Figure 3 below, sentences such as, profit taking NSE, government private sector, cross boarder trade, cargo tracking note, and capital market sec are among the top 10 three word sentence that influence the negative returns of NSE. From this, we can infer that by seeing these sentences in news headlines, we should prepare for a negative NSE return. Words such as poor purchasing power, naira watch cbn, mtn google empower, google empower smes and external reserve hit are top 10 three word sentence that have a positive influence on the return of NSE. Based on this information, it is evident that if we encounter these sentences in news headlines, we should anticipate a favorable return from the NSE.
Figure 3. A Bar Graph of Trigram for NSE Negative and Positive Returns.
4.2. Estimation Results
In this paper, we built three classification models.
Tables 2-4 shows the confusion matrix for all the models, and
Table 5 presents their measure of accuracy.
Table 2. A Confusion Matrix for Logistic Regression.
Predicted/Actual | Positive Class | Negative Class |
Positive Class | 1646 (53.0%) | 1460 (47.0%) |
Negative Class | 1169 (50.3%) | 1154 (49.7%) |
From the
Table 2 above, we see that in the positive class, the logistic regression model classifies 53.0% correct and 47.0% falsely. We see that in the negative class, the model classifies 49.7%%correctly, and 49.7% falsely.
Table 3. A Confusion Matrix for Support Vector Machine.
Predicted/Actual | Positive Class | Negative Class |
Positive Class | 1873 (52.5%) | 1698 (48.5%) |
Negative Class | 942 (50.7%) | 916 (49.3%) |
From the
Table 3 above, we see that in the positive class, the logistic regression model classifies correctly 52.5% correct and 48.5% falsely. We see that in the negative class, the model classifies 49.3% correctly, and 50.7% falsely.
Table 4. A Confusion Matrix for K-Nearest Neighbour.
Predicted/Actual | Positive Class | Negative Class |
Positive Class | 2798 (99.2%) | 23 (0.8) |
Negative Class | 17 (0.7%) | 2591 (99.3%) |
From the
Table 2 above, we see that in the positive class, the logistic regression model can classify correctly 99.2% and 0.8% falsely. We see that in the negative class, the model classifies 99.3% correctly, and 0.7% falsely.
After calculating the confusion matrix, we use formula 5 indicated in the methodology to calculate the accuracy, which helps us to measure the accuracy of the models as shown in the
Table 5 below.
Table 5. Three Machine Learning Models and their Accuracy Levels.
Model Name | Model Accuracy |
Logistic Regression | 0.52 |
Support Vector Machines (SVM) | 0.51 |
K Nearest Neighbour (KNN) | 0.99 |
Table 1 presents the results of the accuracy levels of the three models built for the prediction of NSE returns using news headlines. We see that among the three models, KNN outperforms the SVM and logistic regression models. Logistic regression slightly outperformed the SVM model.
5. Conclusion and Recommendation
This paper sought to determine the words and sentences that influence the outcomes of NSE daily stock returns. This was achieved using the TF-IDF. Our results showed that words such as arabia, crypto, renewal, paris, and tradermoni were the most influential words in bringing about negative NSE. Words such as lawmakers, multinationals, ebonyi, constraints and double, were more influential in bringing about positive NSE returns. Looking at the two-word sentences created, we find that sentences such asprice dip, earning rise, tax compliance, and econbank partners were very influential in causing NSE negative returns, while sentences such as trustfunds pensions, inter agency, business insurance, index rise and forex supply all had positive influence on NSE returns. In addition, looking at three-words sentences, we find that words such as government private sector, cross boarder trade, cargo tracking note, and capital market sec all have a more negative influence on NSE daily returns. While words such as naira watch cbn, mtn google empower, google empower smes and external reserve hit all had more positive influence on the NSE daily returns. From the above deductions using unigram, bigrams and trigram, we noticed that as we increased the sentence words, we got a more realistic result. Sentences aligned more with the NSE returns, by this we mean, sentences with negative tones aligned with negative NSE returns, and sentences with positive tones, aligned with NSE positive returns.
We build three machine learning models; the logistic regression, achieved an accuracy of 0.52. This was followed by SVM, which exhibited a slightly lower accuracy of 0.51, then, the KNN model surpassed, which surpassed the earlier two, boasting an impressive accuracy of 0.99. We see that the KNN model fits better on our data for prediction, than the SVM and logistics regression.
While we succeeded in building machine learning models to suit words that can be used for predictions, this work limits itself to fitting models on only unigram. Further work can be done to fit these models on bigrams and trigrams or more to see if the machine learning models will perform better or not.
Abbreviations
TF-IDF | Frequency-Inverse Document Frequency |
SVM | Support Vector Machine |
KNN | K Nearest Neighbour |
NSE | Nigerian Stock Exchange |
ML | Machine Learning |
EMH | Efficient Market Hypothesis |
LSTM | Long Short-term Memory |
GRU | Gated Recurrent Unit |
SMEDAN-SA | Social Media Built Social Medial Analyzer |
NLP | Natural Language Processing |
ASI | All Share Index |
TP | True Positive |
FP | False Positive |
FN | False Negative |
EDA | Exploratory Data Analysis |
Data and R Codes Availability
The data and codes used for this work will be made available on request.
Conflicts of Interest
The authors declare no conflicts of interest.
References
| [1] |
Abe, M., & Nakayama, H. (2018). Deep learning for forecasting stock returns in the cross-section. In Advances in Knowledge Discovery and Data Mining: 22nd Pacific-Asia Conference, PAKDD 2018, Melbourne, VIC, Australia, June 3-6, 2018, Proceedings, Part I 22 (pp. 273-284). Springer International Publishing.
https://doi.org/10.48550/arXiv.1801.01777
|
| [2] |
Afego, P. N. (2017). Effects of changes in stock index compositions: A literature survey. International Review of Financial Analysis, 52, 228-239.
https://doi.org/10.1016/j.irfa.2017.06.004
|
| [3] |
Atoi, N. V. (2014): Testing Volatility in Nigeria Stock Market using GARCH Models. CBN Journal of Applied Statistics Vol. 5 No. 2.
|
| [4] |
Chenglin, X., Weili, X. & Jijiao, J. (2020). Stock price forecast based on combined model of ARI-MA-LS-SVM. Neural Computing and Applications
https://doi.org/10.1007/s00521-019-04698-5
|
| [5] |
Feldman, R., & Sanger, J. (2007). The text mining handbook: advanced approaches in analyzing unstructured data. Cambridge university press.
|
| [6] |
Ibrahim, O. Sikiru (2017). Forecasting the Volatilities of the Nigeria Stock Market Prices. CBN Journal of Applied Statistics 8(2); 23-45.
|
| [7] |
Isenah, M. G. and Olubusoye O. E. (2014). Forecasting Nigerian Stock Market Returns using ARIMA and Artificial Neural Network Models. CBN Journal of Applied Statistics 5(2); 25-48.
|
| [8] |
Kohara K, Ishikawa T, Fukuhara Y, Nakamura Y. Stock price prediction using prior knowledge and neural networks. Intelligent Systems in Accounting, Finance & Management. 1997; 6(1): 11–22.
|
| [9] |
Kuiken, J., Schuth, A., Spitters, M., & Marx, M. (2017). Effective headlines of newspaper articles in a digital environment. Digital Journalism, 5(10), 1300-1314.
https://doi.org/10.1080/21670811.2017.1279978
|
| [10] |
Kwartler, T. (2017). Text mining in practice with R. John Wiley & Sons.
|
| [11] |
Li, B., Chan, K. C., Ou, C., & Ruifeng, S. (2017). Discovering public sentiment in social media for predicting stock movement of publicly listed companies. Information Systems, 69, 81-92.
https://doi.org/10.1016/j.is.2016.10.001
|
| [12] |
Moh, M., Gajjala, A., Gangireddy, S. C. R., & Moh, T. S. (2015, December). On multi-tier sentiment analysis using supervised machine learning. In 2015 IEEE/WIC/ACM International Conference on Web Intelligence and Intelligent Agent Technology (WI-IAT) (Vol. 1, pp. 341-344). IEEE.
https://doi.org/10.1109/WI-IAT.2015.154
|
| [13] |
Mittermayer, M. A. (2004, January). Forecasting intraday stock price trends with text mining techniques. In 37th Annual Hawaii International Conference on System Sciences, 2004. Proceedings of the (pp. 10-pp). IEEE.
https://doi.org/10.1109/HICSS.2004.1265201
|
| [14] |
Nwabueze, C., Okafor, I., & Obiakor, C. Exposure to Economic News on News Tickers and its Influence on Perception of Nigeria Economy by Television Audience in Awka.
|
| [15] |
Olley, O. W. (2015). Readers' perception of Nigerian newspapers on the internet. In Journal of Philosophy, Culture and Religion (Vol. 4, pp. 26-34).
|
| [16] |
Osisanwo, B. G., & Atanda, A. A. (2012). Determinants of stock market returns in Nigeria: a time series analysis. African Journal of Scientific Research, 9(1).
|
| [17] |
Shahi TB, Shrestha A, Neupane A, Guo W. Stock price forecasting with deep learning: A comparative study. Mathematics. 2020; 8(9): 1441.
https://doi.org/10.3390/math8091441
|
| [18] |
Srivastava, A. N., & Sahami, M. (2009). Text mining: Classification, clustering, and applications. Chapman and Hall/CRC.
|
| [19] |
Uzuke, C. A., & Daniel, J. (2016). Timeseries Analysis of All Shares Index of Nigerian Stock Exchange: A Box-Jenkins Approach. International Journal of Sciences, 5(06), 23-38.
https://doi.org/10.18483/ijSci.922
|
| [20] |
Yaya, O. S. (2013). Nigerian Stock Index: A Search for Optimal GARCH Model using High Frequency Data. CBN Journal of Applied Statistics, 4(2): 69-85.
|
| [21] |
Yaya, O. S., Bada, A. S. and Atoi, N. V. (2016). Volatility in the Nigerian Stock Market: Empirical Application of Beta-t-GARCH Variants. CBN Journal of Applied Statistics, 7(2): 27-48.
|
Cite This Article
-
APA Style
Ayantse, C., Yaya, O. S., Joseph, O. U., Arawomo, D. F. (2024). Predicting Nigerian Stock Market Returns Based on Daily Business News Headlines. Science Journal of Applied Mathematics and Statistics, 12(6), 90-98. https://doi.org/10.11648/j.sjams.20241206.11
 Copy
|
Copy
|
 Download
ACS Style
Ayantse, C.; Yaya, O. S.; Joseph, O. U.; Arawomo, D. F. Predicting Nigerian Stock Market Returns Based on Daily Business News Headlines. Sci. J. Appl. Math. Stat. 2024, 12(6), 90-98. doi: 10.11648/j.sjams.20241206.11
Copy
|
Download
-
@article{10.11648/j.sjams.20241206.11,
  author = {Cornelius Ayantse and OlaOluwa Simon Yaya and Okeke Uchenna Joseph and Damilola Felix Arawomo},
  title = {Predicting Nigerian Stock Market Returns Based on Daily Business News Headlines
},
  journal = {Science Journal of Applied Mathematics and Statistics},
  volume = {12},
  number = {6},
  pages = {90-98},
  doi = {10.11648/j.sjams.20241206.11},
  url = {https://doi.org/10.11648/j.sjams.20241206.11},
  eprint = {https://article.sciencepublishinggroup.com/pdf/10.11648.j.sjams.20241206.11},
  abstract = {This study predicts daily returns of the Nigerian Stock Exchange (NSE) using Nigerian daily news headline. The Vanguard newspaper is used as the source of information, to collate 11 years (2February 2, 2012 to September 29, 2023) of daily news headlines and data on the daily returns All-Shares Index (ASI) of the Nigerian Stock Exchange NSE was collared from the website https://ng.investing.com/indices/nse-all-share-historical-data. Text mining techniques such as Term Frequency-Inverse Document Frequency (TF-IDF) are applied to pre-determine important words and sentences and their influences on daily market returns. N-gram sentences are used to build bigrams and trigrams, which helps us determine their positive and negative returns. The result shows that when words such arabia, crypto, renewal, paris, and tradermoni appear in news headlines, there is negative returns in the stock market, but when words such as lawmakers, multinationals, ebonyi, constraints and double appear in the news headline, there is positive return. For bi-gram sentences when sentences such as price dip, earning rise, tax compliance, and econbank partners appear, there is often negative return, on the other hand when sentences such as trustfunds pensions, inter agency, business insurance, index rise and forex supply appear in the news headline, there is often positive return. And for tri-gram sentences, when sentences such as profit taking NSE, government private sector, cross boarder trade, cargo tracking note, and capital market sec, there is often negative return in NSE, on the other hand, when sentence such as poor purchasing power, naira watch cbn, mtn google empower, google empower smes and external reserve hit appear in the news headlines, there is often a positive returns in the stock market. Three machine-learning models were used to build the predictive models. The models were logistic regression with a prediction accuracy of 0.52, Support Vector Machine (SVM) with an accuracy of 0.51, and K-nearest Neighbour (KNN) with an accuracy of 0.99, indicating higher prediction evidence of news headlines by the KNN model for the NSE index over the alternative models. We limited fitting the models using only unigrams and left fitting models using bigrams and trigram sentences for future research.
},
 year = {2024}
}
Copy
|
Download
-
TY  - JOUR
T1  - Predicting Nigerian Stock Market Returns Based on Daily Business News Headlines

AU  - Cornelius Ayantse
AU  - OlaOluwa Simon Yaya
AU  - Okeke Uchenna Joseph
AU  - Damilola Felix Arawomo
Y1  - 2024/11/22
PY  - 2024
N1  - https://doi.org/10.11648/j.sjams.20241206.11
DO  - 10.11648/j.sjams.20241206.11
T2  - Science Journal of Applied Mathematics and Statistics
JF  - Science Journal of Applied Mathematics and Statistics
JO  - Science Journal of Applied Mathematics and Statistics
SP  - 90
EP  - 98
PB  - Science Publishing Group
SN  - 2376-9513
UR  - https://doi.org/10.11648/j.sjams.20241206.11
AB  - This study predicts daily returns of the Nigerian Stock Exchange (NSE) using Nigerian daily news headline. The Vanguard newspaper is used as the source of information, to collate 11 years (2February 2, 2012 to September 29, 2023) of daily news headlines and data on the daily returns All-Shares Index (ASI) of the Nigerian Stock Exchange NSE was collared from the website https://ng.investing.com/indices/nse-all-share-historical-data. Text mining techniques such as Term Frequency-Inverse Document Frequency (TF-IDF) are applied to pre-determine important words and sentences and their influences on daily market returns. N-gram sentences are used to build bigrams and trigrams, which helps us determine their positive and negative returns. The result shows that when words such arabia, crypto, renewal, paris, and tradermoni appear in news headlines, there is negative returns in the stock market, but when words such as lawmakers, multinationals, ebonyi, constraints and double appear in the news headline, there is positive return. For bi-gram sentences when sentences such as price dip, earning rise, tax compliance, and econbank partners appear, there is often negative return, on the other hand when sentences such as trustfunds pensions, inter agency, business insurance, index rise and forex supply appear in the news headline, there is often positive return. And for tri-gram sentences, when sentences such as profit taking NSE, government private sector, cross boarder trade, cargo tracking note, and capital market sec, there is often negative return in NSE, on the other hand, when sentence such as poor purchasing power, naira watch cbn, mtn google empower, google empower smes and external reserve hit appear in the news headlines, there is often a positive returns in the stock market. Three machine-learning models were used to build the predictive models. The models were logistic regression with a prediction accuracy of 0.52, Support Vector Machine (SVM) with an accuracy of 0.51, and K-nearest Neighbour (KNN) with an accuracy of 0.99, indicating higher prediction evidence of news headlines by the KNN model for the NSE index over the alternative models. We limited fitting the models using only unigrams and left fitting models using bigrams and trigram sentences for future research.

VL  - 12
IS  - 6
ER  -
Copy
|
Download